Posts

Showing posts from July, 2017

Box Cox Transformations in Python

Image
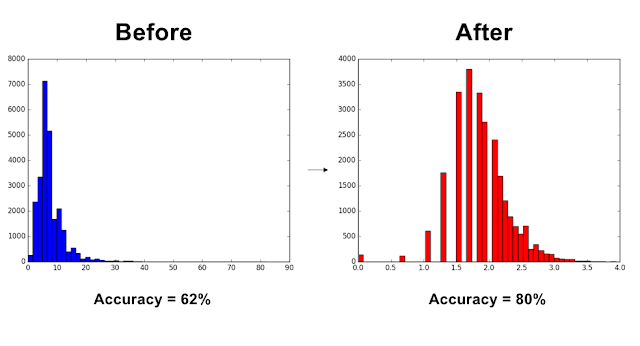
Many common machine learning algorithms assume data is normally distributed. But what if your data isn't? I experienced this frustration first hand during my undergraduate thesis, I was attempting to predict the category of online slot-machine a customer was using based on some information about their bet size, speed of play etc. Unfortunately no matter what algorithm I used or what hyper-parameter I modified, I still couldn't achieve accuracy over ~60%. Nearing the end of the school semester I was reading about improving classifier performance when I had my "Eureka!" moment, of course non of these algorithms were performing well. When people play slot machines, the vast majority will bet the minimum stakes with only the most adventurous and financially well-off people betting significantly more. My data was indeed not normally distributed.  A quick google search for "How to fix non-normally distributed data" revealed the  Box Cox Transformation .

k-Folds Cross Validation in Python

Image
How do we evaluate the accuracy of a machine learning algorithm? It is customary when evaluating any machine learning classification model to split the dataset into separate training and testing sets. One convention is 80% training and 20% testing, but what if your dataset is rather small? 20% of an already minimal dataset can lead to false accuracy reporting. Furthermore, such small selections may not be truly representative of the full dataset. One of the solutions to this problem is k-folds cross validation. The Basic Idea If we have 100 rows in our data set, typically 20 of these rows would be selected as a testing set, leaving the remaining 80 rows as a training set. In k-Folds Cross Validation we start out just like that, except after we have divided, trained and tested the data,  we will re-generate our training and testing datasets using a different  20% of the data as the testing set and add our old testing set into the remaining 80% for training. This process cont

Univariate Linear Regression in Python

Image
Introduction Does x predict y ? This is the basic question that linear regression aims to answer, or at least give a hint about. Technically speaking, linear regression is a way of establishing if two variables are related. In this post we need to be familiar with the idea of both dependent and independent variables. Generally, the dependent variable or " y"   is the variable that we are measuring (it can help also to frame this as the outcome ). The independent variable or " x" is the variable that is modified or changed. If these two variables are at all correlated, a change in the independent variable should result in a somewhat reliable change in the dependent variable. For example, lets say we are interested in how rainfall effects umbrella usage, we could hypothesize that the more it rains, the more likely people are to use an umbrella. In this case our independent variable is rainfall lets quantify that as mm per day. Our dependent variable is umb